Horse Racing Form Guide: How to Read Form and Use It
Form Is the Closest Thing to a Crystal Ball in Racing
I remember standing in the parade ring at Newbury, watching a horse that looked magnificent — glossy coat, calm demeanour, muscles rippling under the afternoon sun. I backed it at 5/2. It finished seventh of eight. The form book, which I had not checked, told a different story: the horse had finished out of the first four in its last six starts and was dropping in class for the third time. That was the day I stopped trusting my eyes and started trusting the numbers.
Form — a horse’s record of recent race results — is the bedrock of informed betting. In a sport where racecourse attendance topped 5.031 million in 2025, the first time it exceeded five million since 2019, there is no shortage of spectators. But the gap between watching and understanding is vast. Form study bridges it. It tells you not just whether a horse won or lost, but how it won, who it beat, on what ground, over what distance, and under what weight. Every piece of that puzzle matters.
This guide is built for punters who want to move beyond gut instinct. I am not going to pretend form reading is quick — it takes time, and the more races you study, the better your eye becomes. But even a basic framework will sharpen your selections faster than any tip sheet.
Decoding Form Figures: Numbers, Letters, and Symbols
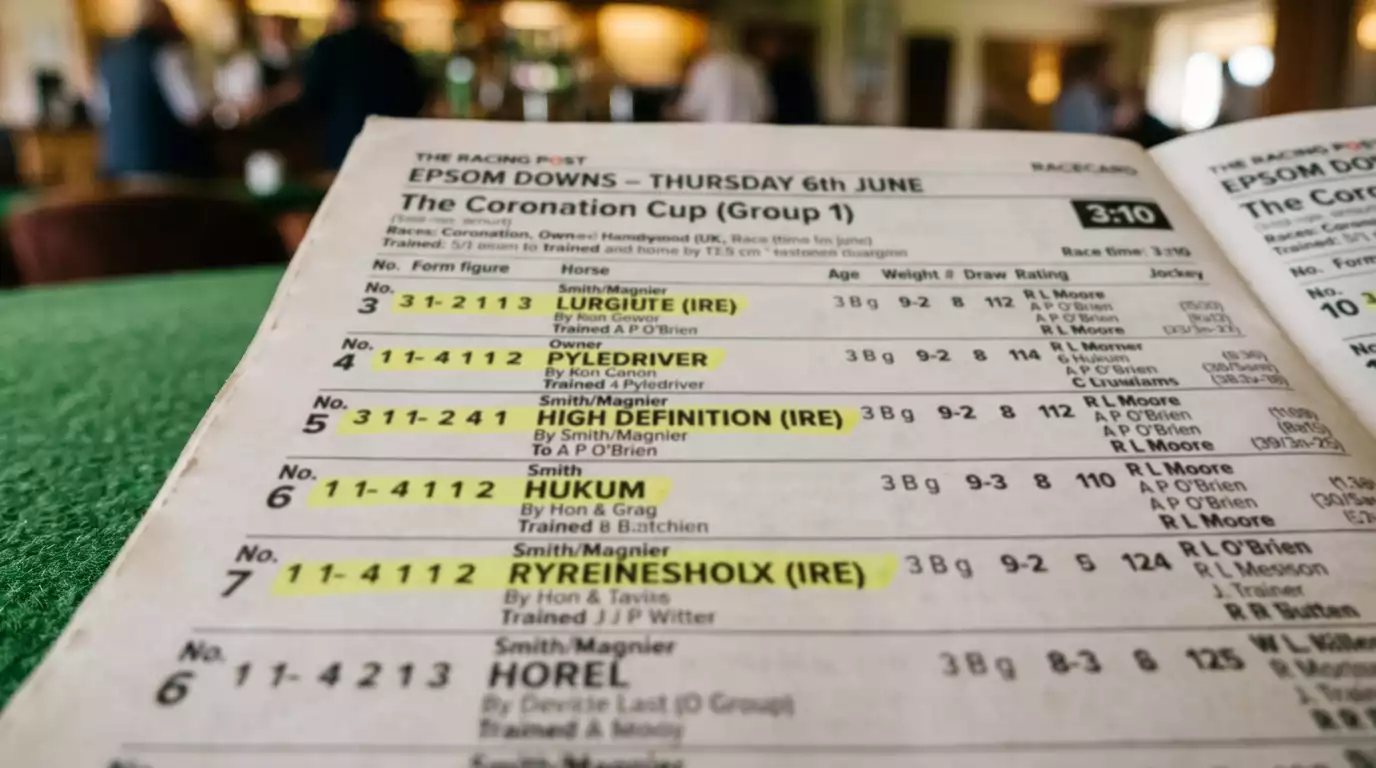
Open any racecard and you will see a string of characters beside each horse’s name. Something like 2134-51. Those numbers and symbols are the form figures, and they pack a surprising amount of information into a tight space once you know the code.
Each digit represents a finishing position in a recent race, read from left to right with the most recent run on the far right. So 2134-51 means the horse finished second, then first, then third, then fourth, had a break (that is what the hyphen indicates — a gap between seasons or a significant layoff), then fifth, and most recently first. Simple enough at first glance, but the detail matters. A “1” at Cheltenham in a Grade 2 hurdle is not the same as a “1” in a seller at Catterick.
Letters carry their own meaning. “F” means the horse fell, “U” means it unseated its rider, “P” means it was pulled up, and “R” means it refused. In National Hunt racing, these are critical. A horse showing F or U in recent form has a jumping problem, and while some horses overcome it, the risk is real. “C” indicates a horse was carried out by another runner — not its fault, but still a race where it failed to complete.
The slash or hyphen between groups of figures separates seasons. Form from a previous campaign is still relevant, but it carries less weight than recent runs. A horse returning from a long absence might be sharper or duller than its old form suggests, and that uncertainty is reflected in the odds. I pay particular attention to horses whose most recent figure is strong but whose earlier form was patchy — it can signal improvement that the market has not fully priced in.
Beyond the numbers, look for the lowercase letters that appear alongside some entries. A “t” means the horse wore a tongue tie, “b” indicates blinkers, “v” means a visor, and “p” stands for cheekpieces. Equipment changes are significant: blinkers applied for the first time, for example, often signal a trainer trying to sharpen a horse’s focus, and first-time blinkers have a notably higher strike rate than the base rate in many race categories.
Trainer and Jockey Statistics That Actually Matter
There is a trainer in the north of England whose strike rate at his local course hovers around 28%. His overall national strike rate is closer to 12%. If you bet his runners at every track equally, you would do fine. If you only backed them at his local course, you would do considerably better. That kind of granularity is where trainer stats become genuinely useful.
The raw numbers are easy to find — websites and racecards list trainer win percentages freely. But the headline figure is almost useless on its own. What you want is the context: trainer strike rate by course, by race type, by distance range, and by ground condition. A flat trainer who excels with two-year-olds in the first half of the season might be mediocre with older horses. A jumps trainer with a 20% strike rate in novice hurdles might drop to 8% in handicap chases. The number of horses in training across Britain fell to 21,728 in 2025, a 2.3% decline from the previous year, which means the population of active trainers is shifting too — smaller yards are closing, and the runners are concentrating among fewer operations.
Jockey statistics follow a similar pattern. A top jockey’s overall win rate tells you they are good — you knew that already. What is more interesting is their record with specific trainers, on specific courses, or in specific race conditions. Some jockeys ride noticeably better on left-handed tracks. Others have a strong record when riding for a particular stable, suggesting a rapport with the training methods. I keep a simple spreadsheet of trainer-jockey combinations that outperform their individual averages. It is a small edge, but edges compound.
A Three-Step Method for Shortlisting Runners
I have tried elaborate form-study systems with ten or twelve variables, and I have tried the simple “back the top-rated” approach. Over the years, I have settled on a three-step method that balances depth with practicality. It works for any race type, flat or jumps.
Step one: eliminate. Look at the field and remove any horse that clearly does not fit the race conditions. Wrong distance, wrong going, poor recent form with no excuses, returning from a long injury layoff with no prep run — cross them off. In a twelve-runner handicap, you can usually eliminate four or five runners in under two minutes. This narrows the real contest to a manageable group.
Step two: compare. For the surviving runners, look at their best recent form and ask a direct question: which of these horses has the strongest piece of form when you adjust for class? A horse that finished third in a Class 2 at York might be better than a horse that won a Class 4 at Beverley, even though the second horse’s form figures look flashier. Class adjustment is the single most underrated skill in form reading, and it is what separates sharp punters from recreational ones.
Step three: price. Once you have your shortlist — usually two or three runners — assign each a rough probability based on your analysis. Then compare those probabilities with the bookmaker odds. If the market agrees with you, there is usually no value. If the market disagrees and you trust your analysis, that is where a data-driven approach to horse racing betting earns its keep. The whole process takes ten to fifteen minutes per race. It will not make you right every time, but it builds a habit of disciplined analysis that pays off over hundreds of bets.
Frequently Asked Questions
Where can I find free form guides for UK horse racing?
The Racing Post website offers basic form data for free, including recent results, trainer and jockey records, and racecard information. At The Races and Sporting Life also provide free form guides. For deeper analysis — sectional timing, speed figures, pace maps — you will typically need a paid subscription or a specialist data provider.
What do the numbers and letters in horse racing form mean?
Numbers represent finishing positions in recent races, read left to right with the most recent run last. Letters indicate non-completions: F for fell, U for unseated rider, P for pulled up, R for refused. A hyphen or slash separates different racing seasons. Lowercase letters like b (blinkers), t (tongue tie), and v (visor) show equipment worn during that run.
Prepared by the Horse bet Racing editorial staff.