Horse Racing Odds Explained: Fractional, Decimal, and Starting Price
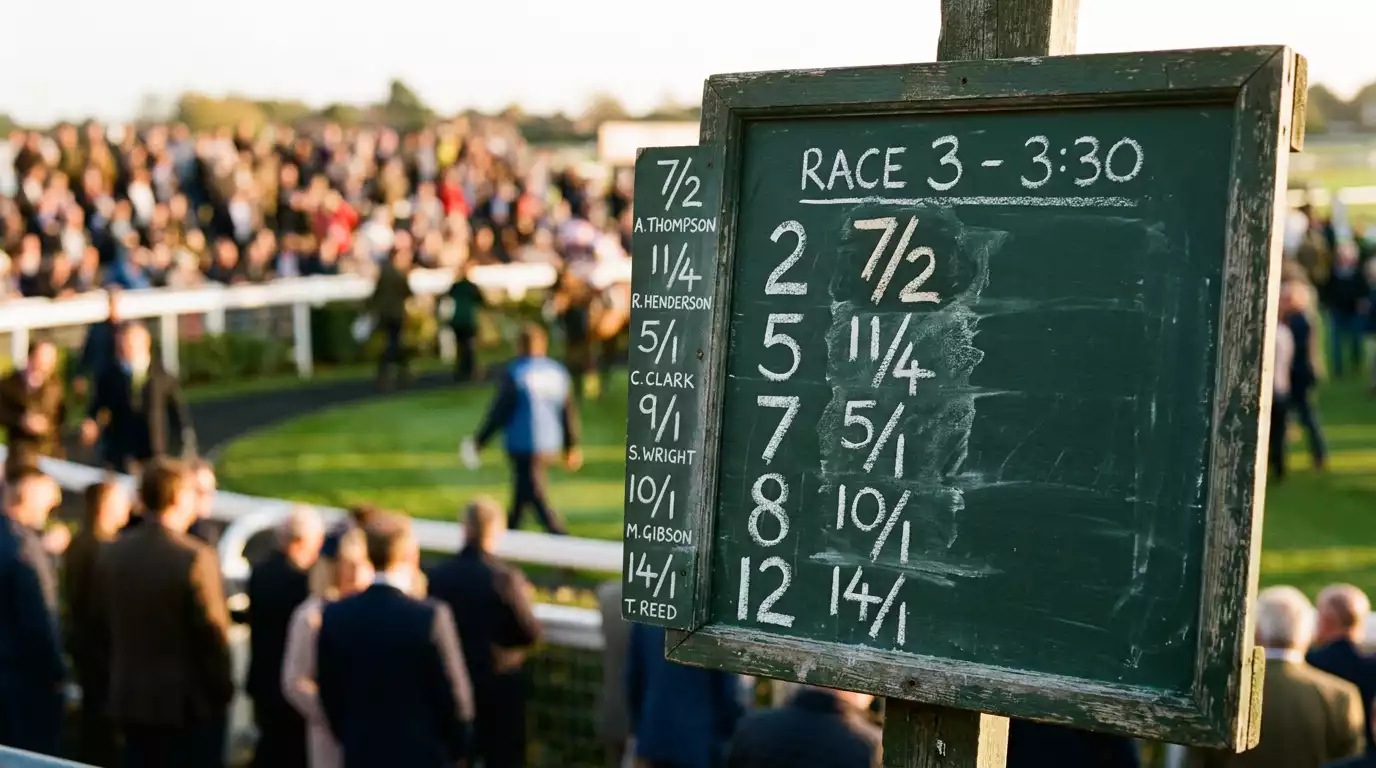
Table of Contents
- What Horse Racing Odds Actually Tell You
- Fractional Odds: The Traditional UK Format
- Decimal Odds: Quick Conversion and When They Help
- Starting Price (SP): How It Is Set and When It Applies
- Why Odds Move: Steam, Drifters, and Market Signals
- Converting Odds to Implied Probability
- The Overround: How Bookmakers Build Their Margin
- Frequently Asked Questions
What Horse Racing Odds Actually Tell You
I spent my first six months betting on horses without truly understanding what the numbers next to their names meant. I knew that 10/1 paid more than 2/1, and that was about the extent of it. The day I sat down and properly learned how odds work — not just what they pay, but what they imply about probability and where the bookmaker’s profit hides — was the day my entire approach changed. It was like switching from guessing to measuring.
Horse racing odds are a language. They express how likely the market believes a particular outcome is, translated into a payout ratio. The gross gambling yield from remote horse racing betting alone reached £766.7 million in the year ending March 2025, and every penny of that flowed through odds — set, moved, accepted, and settled. Understanding this language is not optional if you intend to bet with any degree of intention. It is foundational.
In the UK, you will encounter three primary formats: fractional odds (the traditional format you see chalked on boards at the racecourse), decimal odds (increasingly common online and standard across Europe), and Starting Price, or SP, which is a specific mechanism for determining the final odds at the moment a race begins. Each format conveys the same underlying information — the relationship between your stake and your potential return — but they express it differently, and the ability to move fluently between them gives you a practical advantage when comparing prices across bookmakers or evaluating whether a bet offers genuine value.
Fractional Odds: The Traditional UK Format
Walk into any betting shop or glance at a racecourse bookmaker’s board and the numbers you see — 5/1, 7/2, 11/4 — are fractional odds. They have been the default in British racing for over a century, and despite the rise of decimal formats online, they remain the language most UK punters think in. If you only learn one format properly, make it this one.
The structure is simple: the number on the left is your potential profit, the number on the right is the stake required to generate that profit. At 5/1, every £1 you stake returns £5 in profit plus your original £1 back — a total return of £6. At 7/2, a £2 stake yields £7 profit, so a £1 stake yields £3.50 profit and £4.50 total. At 11/4, a £4 stake produces £11 profit, meaning a £1 bet returns £3.75 total.
Some prices look intimidating at first glance. What does 100/30 mean? It means for every £30 staked, you win £100 profit. Divide 100 by 30 and you get 3.33 — so a £1 bet returns £4.33 total. The trick is always the same: divide the left number by the right number to get your profit per pound.
Certain fractions have nicknames embedded in racing culture. “Evens” means 1/1 — you double your money. “Odds on” describes any price shorter than evens, where your potential profit is less than your stake: at 4/6, you risk £6 to win £4. “Odds against” is anything longer than evens. These terms come up constantly in commentary and analysis, so recognising them saves you from feeling like an outsider in a conversation you should be part of.
One thing fractional odds do not immediately show you is the total return on a complex stake. If you bet £8 at 9/4, the quick mental calculation is: 9 divided by 4 equals 2.25, multiply by 8 equals £18 profit, add back the £8 stake for £26 total. With practice this becomes automatic, but if mental arithmetic is not your strength, there is a format designed to make the maths trivially easy.
Let me walk through a real-world scenario to anchor this. You fancy a horse in the 3:15 at Kempton. The bookmaker is offering 7/2. You decide to stake £10. Your profit calculation: 7 divided by 2 equals 3.5, multiplied by your £10 stake equals £35 profit. Add back your £10 and the total return is £45. Now, the horse drifts to 4/1 before the off. The same £10 stake now yields £40 profit and £50 total. That difference — £5 on a single £10 bet — is exactly why price comparison matters, and why understanding fractional odds fluently gives you the ability to make those comparisons in real time, standing in a betting ring or staring at a mobile screen with seconds to spare.
Decimal Odds: Quick Conversion and When They Help
Decimal odds arrived in UK racing via betting exchanges and European sportsbooks, and they have a single, enormous advantage: the number you see is your total return per pound staked. No division, no separating profit from stake. At decimal odds of 6.00, a £1 bet returns £6. At 3.50, it returns £3.50. At 1.67, it returns £1.67. Done.
Converting between fractional and decimal is mechanical. Take the fractional odds, divide the top by the bottom, then add 1. So 5/1 becomes (5 / 1) + 1 = 6.00. 7/2 becomes (7 / 2) + 1 = 4.50. 11/4 becomes (11 / 4) + 1 = 3.75. Going the other direction — from decimal to fractional — subtract 1 and express the result as a fraction. Decimal 4.00 is 3/1. Decimal 2.50 is 3/2. Decimal 1.80 is 4/5.
Where decimal odds genuinely outperform fractions is in comparing prices quickly and in calculating accumulators. If you are looking at three bookmakers offering 3.75, 3.80, and 3.60 on the same horse, the best price jumps out instantly. In fractional form — 11/4, 14/5, 13/5 — the comparison requires more effort. For accumulators, you multiply decimal odds together: a treble on selections at 3.00, 2.50, and 4.00 returns 3.00 x 2.50 x 4.00 = 30.00 per pound staked. Try doing that quickly with 2/1, 6/4, and 3/1.
Most UK bookmakers let you toggle between formats in your account settings. I keep mine on decimal for analytical work and switch to fractional when I am at the track, because that is what the boards show and what the on-course bookmakers quote. There is no “better” format — only the one that lets you process information fastest in a given context.
Starting Price (SP): How It Is Set and When It Applies
Years ago, before live odds updates pinged to every smartphone in the country, the Starting Price was the only number that mattered. You walked into a betting shop, put your money down “at SP,” and whatever the official price was when the tape went up, that is what you got paid. The mechanism still exists, and it still plays a significant role in modern racing — more than most casual bettors realise.
The Starting Price is determined by independent assessors employed by the Starting Price Regulatory Commission (SPRC). These assessors stand in the betting ring at the racecourse and record the odds being offered by on-course bookmakers in the final moments before the race starts. From those observations, they calculate an official price for each runner that represents the prevailing market at the off. This price is then used to settle any bet placed “at SP” rather than at a fixed price.
Why would you bet at SP instead of taking a fixed price? In practice, most online bettors take fixed odds — the price you see and click. But SP becomes relevant in two situations. First, if you place a bet without specifying a price (some older retail processes default to SP). Second, and more importantly, through Best Odds Guaranteed (BOG) policies. Many bookmakers offer BOG on UK and Irish racing, which means if you take a fixed price and the SP turns out to be higher, you get paid at the better number. This is free upside, and it makes BOG one of the most valuable features a bookmaker can offer to racing bettors.
The relationship between racing and betting in the UK stretches back over two centuries, as the European Commission noted when clearing state-aid arrangements — for most participants, a day at the races includes placing bets on horse races. SP is a living relic of that history, baked into how the market functions. Even if you never deliberately bet at SP, understanding it helps you evaluate whether the fixed price you are taking represents genuine value relative to what the on-course market settles on.
One practical habit I developed early was checking the SP after a race, regardless of whether I took a fixed price. If I consistently found that the SP was shorter than the price I locked in, it meant I was doing something right — taking value before the market caught up. If the SP was regularly longer than my fixed price, I was betting too early or on horses the on-course market respected less than the morning-market suggested. Over time, this simple comparison sharpened my sense of timing and taught me when to take an early price versus when to wait for the show to develop.
Why Odds Move: Steam, Drifters, and Market Signals
If you have ever refreshed a page and noticed a horse’s price drop from 8/1 to 5/1 in the space of ten minutes, you have witnessed a “steamer” — a runner attracting heavy money that forces the bookmaker to shorten its odds. If you have watched a price drift outward from 3/1 to 6/1, that horse is a “drifter,” and the market is telling you that informed money is going elsewhere. Learning to read these movements is one of the most practical skills in horse racing betting.
Odds move for three primary reasons. The first is genuine information: connections know their horse is in peak condition, a trainer’s yard is in flying form, or a jockey switch signals serious intent. This money tends to arrive early in the day and moves the price steadily. The second is public sentiment: a popular horse with a memorable name or a high-profile jockey attracts recreational stakes that compress the price without necessarily reflecting the horse’s true chance. The third is balancing the book: bookmakers adjust prices to manage their liability, shortening odds on horses they have taken too many bets on and lengthening odds on those they need to attract money to.
The data tells a clear story about where money is concentrating. Average betting turnover per race on Premier Fixtures — the flagship meetings at major courses — rose 1.1% in 2025, while turnover on Core Fixtures fell 8.1%. This divergence means the big-money action is increasingly focused on high-profile races, and the market signals in those races are correspondingly sharper. Price movements in a Premier Fixture handicap at York carry more informational weight than the same movement in a low-grade seller at a minor meeting.
Practically, here is how to use this. Check the early-morning prices when markets open, typically between 8:00 and 10:00. Note any significant movers. Then check again thirty minutes before the race. A horse that opened at 12/1 and is now 7/1 without any obvious public reason — no newspaper tip, no social media hype — is worth investigating. It does not mean you should blindly follow the money, but it does mean someone with information is acting on it, and ignoring that signal puts you at a disadvantage.
There is a counterpoint worth making. Not every shortening price is smart money. During the Grand National build-up, public enthusiasm alone can halve a horse’s odds without a shred of analytical reasoning behind the move. Equally, not every drifter is a lost cause — sometimes a horse drifts because casual money is landing elsewhere, not because anything is wrong with the horse. The skill is distinguishing between informed movement and noise, and that takes experience. Keep a log of steamers and drifters, note the outcome, and within a few months you will start spotting the patterns that matter.
Converting Odds to Implied Probability
This is where the numbers stop being abstract and start being genuinely useful. Every set of odds implies a probability — a percentage chance that the horse will win, according to the market. Once you can see odds as probabilities, you stop thinking “5/1 pays well” and start thinking “the market says this horse has a 16.7% chance — do I agree?”
The formula for fractional odds is straightforward: divide the right-hand number by the sum of both numbers, then multiply by 100. At 5/1, the implied probability is 1 / (5 + 1) x 100 = 16.7%. At 2/1, it is 1 / (2 + 1) x 100 = 33.3%. At evens (1/1), it is 50%. At 1/3 (odds-on), it is 3 / (1 + 3) x 100 = 75%.
For decimal odds, the conversion is even simpler: divide 1 by the decimal price and multiply by 100. Decimal 6.00 gives 1 / 6.00 x 100 = 16.7%. Decimal 3.00 gives 33.3%. Decimal 2.00 gives 50%. Decimal 1.33 gives 75%. Same numbers, faster arithmetic.
The moment this becomes powerful is when you compare the implied probability with your own assessment. Suppose you have analysed a race and concluded that a particular horse has roughly a 25% chance of winning. The bookmaker is offering 5/1, which implies 16.7%. The market thinks the horse is less likely to win than you do — meaning at that price, you are getting more for your money than the true probability warrants. That gap is what experienced bettors call “value,” and it is the only sustainable basis for profitable betting over the long run.
Conversely, if you rate a horse at 25% and the odds are 2/1 (implying 33.3%), the price is too short relative to your estimate. Backing it at those odds is paying a premium, and consistent premiums erode your bankroll regardless of whether individual bets win. The calculation takes seconds. The discipline to act on it — walking away from a horse you like because the price is wrong — takes longer to develop, but it is the habit that separates methodical punters from enthusiastic ones.
The Overround: How Bookmakers Build Their Margin
If you add up the implied probabilities of every runner in a race, the total should be 100% in a fair market. In practice, it never is. A typical horse racing market sums to somewhere between 110% and 130%, depending on the number of runners and the bookmaker. That excess above 100% is the overround — the bookmaker’s built-in margin, and it is the reason the house always has a structural edge before a single hoof touches turf.
Here is a concrete example. A four-horse race is priced at 2/1, 3/1, 5/1, and 6/1. The implied probabilities are 33.3%, 25.0%, 16.7%, and 14.3% — adding up to 89.3%. Wait, that is under 100%, which does not look right. But this is the probability from the bettor’s perspective. From the bookmaker’s perspective, the overround is calculated differently: convert the odds to their “true” market values. In this case, the actual market total at these prices gives the bookmaker a margin embedded in each individual price. In a real 12-runner handicap, with tighter prices across more runners, overrounds of 115-125% are common, meaning the bookmaker keeps 15-25% of every pound circulating through the market, mathematically speaking.
Horse racing generally has a lower overround than football or other sports, which is one reason it attracts serious bettors. The gross gambling yield from remote betting tells the story at scale — horse racing generated £766.7 million against football’s £1.3 billion, but racing’s market structure is tighter, and that relative efficiency creates more opportunities for informed punters to find an edge.
You cannot eliminate the overround, but you can minimise its impact. Compare prices across multiple bookmakers before placing a bet. If one operator offers 4/1 and another offers 9/2 on the same horse, the 9/2 is objectively better. Over hundreds of bets, those half-point differences compound. This is not a theoretical exercise — it is the single easiest way to improve your long-term returns without changing anything about your selection process. The ability to read odds fluently, across formats and across operators, is what makes that comparison possible in the first place. Understanding odds is not just about knowing what a bet pays. It is about knowing what it costs, and whether the cost is justified by the probability you assign to the outcome. That shift in perspective — from “what do I win?” to “am I paying the right price?” — is the real value in learning how different bet structures like each-way wagers interact with the odds to create or destroy value.
Frequently Asked Questions
What does ‘evens’ mean in horse racing odds?
Evens, written as 1/1 in fractional format or 2.00 in decimal, means your potential profit equals your stake. A £10 bet at evens returns £20 total — £10 profit plus your £10 stake back. It implies the market gives the horse a roughly 50% chance of winning, before the bookmaker’s margin is factored in.
Are decimal odds more accurate than fractional?
Neither format is more accurate — they express identical information differently. Decimal odds show total return per pound staked, making quick comparisons and accumulator calculations easier. Fractional odds are the traditional UK standard and remain dominant on-course and in racing media. Most bookmakers let you switch between formats in your account settings.
How far in advance do bookmakers publish horse racing odds?
For major events like the Grand National, Cheltenham Festival, or the Derby, ante-post markets open months ahead. For everyday meetings, early prices typically appear on the morning of the race between 8:00 and 10:00, with odds continuing to shift until the off. Overnight markets for the following day’s racing often appear the evening before on major platforms.
Why do odds shorten just before a race starts?
Late money arriving on a particular horse forces bookmakers to cut the price to manage their liability. This can reflect genuine insider confidence — connections know the horse is ready — or simply a surge of public interest triggered by tips, media coverage, or social media buzz. A sharp, unexplained late shortening is often the more informative signal, as it tends to come from knowledgeable sources rather than casual punters.
Written by the editors at Horse bet Racing.